What is MongoDB FTDC (aka. diagnostic.data)
Full Time Diagnostic Data Capture (FTDC) was introduced in MongoDB 3.2 (via SERVER-19585), to incrementally collect the results of certain diagnostic commands to assist MongoDB support with troubleshooting issues.
On log rotation or startup, a mongod or mongos will collect and log:
getCmdLineOpts:db.adminCommand({getCmdLineOpts: true})buildInfo:db.adminCommand({buildInfo: true})hostInfo:db.adminCommand({hostInfo: true})
As configured by diagnosticDataCollectionPeriodMillis and defaulting to every 1 second, FTDC will collect the output of the following commands:
serverStatus:db.serverStatus({tcmalloc: true})replSetGetStatus:rs.status()collStatsfor thelocal.oplog.rscollection (mongod only)connPoolStats(mongos only)
When FTDC is enabled (per diagnosticDataCollectionEnabled), the metrics.xxxxxxx files will be stored in diagnosticDataCollectionDirectoryPath which by default is the diagnostic.data directory within the systemLog.path.
With SERVER-21818 (introduced in MongoDB 3.2.13) and SERVER-31400 (introduced in MongoDB 3.4.16) the diagnostic data capture scope was broadened to not only include internal diagnostic commands but system metrics as well. Depending on the host operating system, the diagnostic data may include one or more of the following statistics:
- CPU utilization (ex:
/proc/stat) - Memory utilization (ex:
/proc/meminfo) - Disk utilization related to performance (ex:
/sys/block/*/stat) - Network performance statistics (
/proc/net/netstat)
The metrics.xxxxxxx files in the diagnostic.data directory contain only statistics about the performance of the system and the database. They are stored in a compressed format, and are not human-readable.
Just a quick note regarding privacy, regardless of the version, the data in diagnostic.data never contains:
- Samples of queries, query predicates, or query results
- Data sampled from any end-user collection or index
- System or MongoDB user credentials or security certificates
FTDC data contains certain host machine information such as hostnames, operating system information, and the options or settings used to start the mongod or mongos. This information may be considered protected or confidential by some organizations or regulatory bodies, but is not typically considered to be Personally Identifiable Information (PII).
If you want to have a closer look at the diagnostic data collection process, you can inspect the FTDC code.
FTDC Structure
There are two types of FTDC documents: a BSON metadata document, or a BSON metric chunk.
Each document is made up of an _id, a type and either a doc or data field. The type field is used to identify the document type:
- 0: Metadata Document
- 1: Metric Chunk
The doc or data fields will contain “samples” in the form of:
1
2
3
4
5
6
7
8
9
10
11
{
  "start" : DateTime, /* Time at which all collecting started */
  "name" : String, /* name is from name() in FTDCCollectorInterface */
  {
        "start" : DateTime, /* Time at which name() collection started */
        "data" : { ... },   /* data comes from collect() in FTDCCollectorInterface */
        "end" : DateTime,   /* Time at which name() collection ended */
  },
  ... /* more than 1 collector be sampled */
  "end" : DateTime /* Time at which all collecting ended */
}
Samples are collected by FTDCCollectorInterface instances.
Metadata Document
1
2
3
4
5
{
  "_id":  DateTime,
  "type": 0,
  "doc":  { .. } /* Samples from collectors */
}
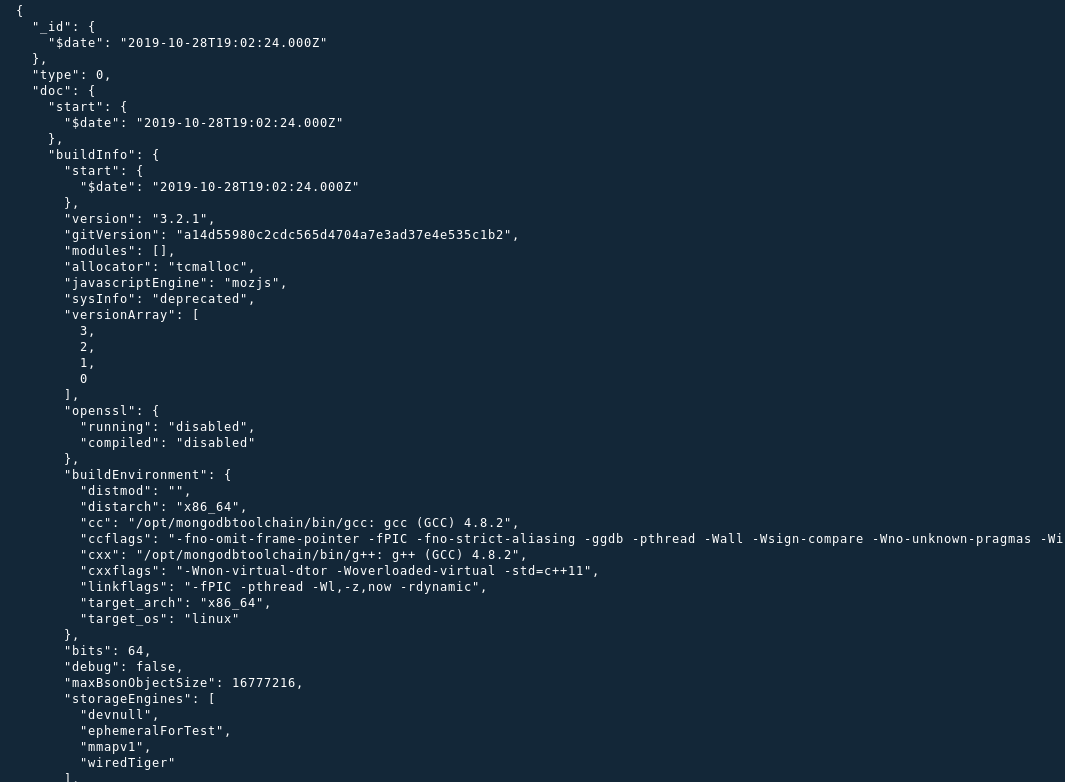
On log rotation or startup, the first FTDC entry will be collected and stored. This is a BSON document that contains information sampled by running getCmdLineOpts, buildInfo and hostInfo.
1
2
3
4
5
6
7
8
// example
{
  "start": DateTime,
  "buildInfo": { ... },
  "getCmdLineOpts": { ... },
  "hostInfo": { ... },
  "end": DateTime
}
This sample will be stored in the doc field of the metadata document.
Metric Chunk
1
2
3
4
5
{
  "_id":  DateTime,
  "type": 1
  "data": BinData(...)
}
During each collection interval (as configured by diagnosticDataCollectionPeriodMillis), a metric chunk will be created and a sample will be collected, compressed and stored to the data document as Binary Data.
This sample can contain the results of internal commands such as serverStatus,replSetGetStatus, collStats for the local.oplog.rs collection or connPoolStats, as well as external system metrics.
1
2
3
4
5
6
7
8
// example
{
  "start": DateTime,
  "serverStatus": { ... },
  "connPoolStats": { ... },
  "systemMetrics": { ... },
  "end": DateTime
}
Decoding FTDC metrics.xxxxxxx files
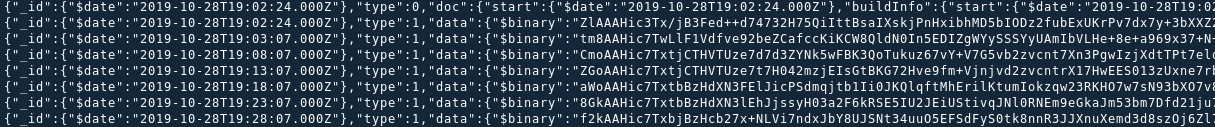
FTDC files, such as the metrics.2019-10-28T19-02-23Z-00000 example file we’ll be working with below are just BSON files. As such, the bsondump utility can be used to inspect the contents:
1
2
METRICS=metrics.2019-10-28T19-02-23Z-00000
bsondump --quiet $METRICS | less
bsondump will default to emitting JSON, so we can interact with this using the jq utility. For example, if we only want to review the Metadata Document this could be done as follows:
1
2
3
4
5
# bsondump < 4.0
bsondump --quiet $METRICS | jq -s '.[] | select( .type == 0)' | less

# bsondump >= 4.0
bsondump --quiet $METRICS | jq -s '.[] | select( .type | ."$numberInt" == "0")' | less
Working with Metric Chunks is a little more complicated as they are actually zlib compressed BSON documents. We’ll use the jq utility to only select the first chunk and the Ruby interpreter to decompress the zlib data. Note that the following command can be altered to navigate to other chunks (not only the first) as needed:
1
2
3
4
5
6
7
8
9
10
11
12
13
14
15
# bsondump < 4.0
METRICS=metrics.2019-12-20T14-22-56Z-00000
bsondump --quiet $METRICS | \
jq -s '.[] | select( .type == 1)' | \
jq -s 'first | .data ."$binary"' -Mc | \
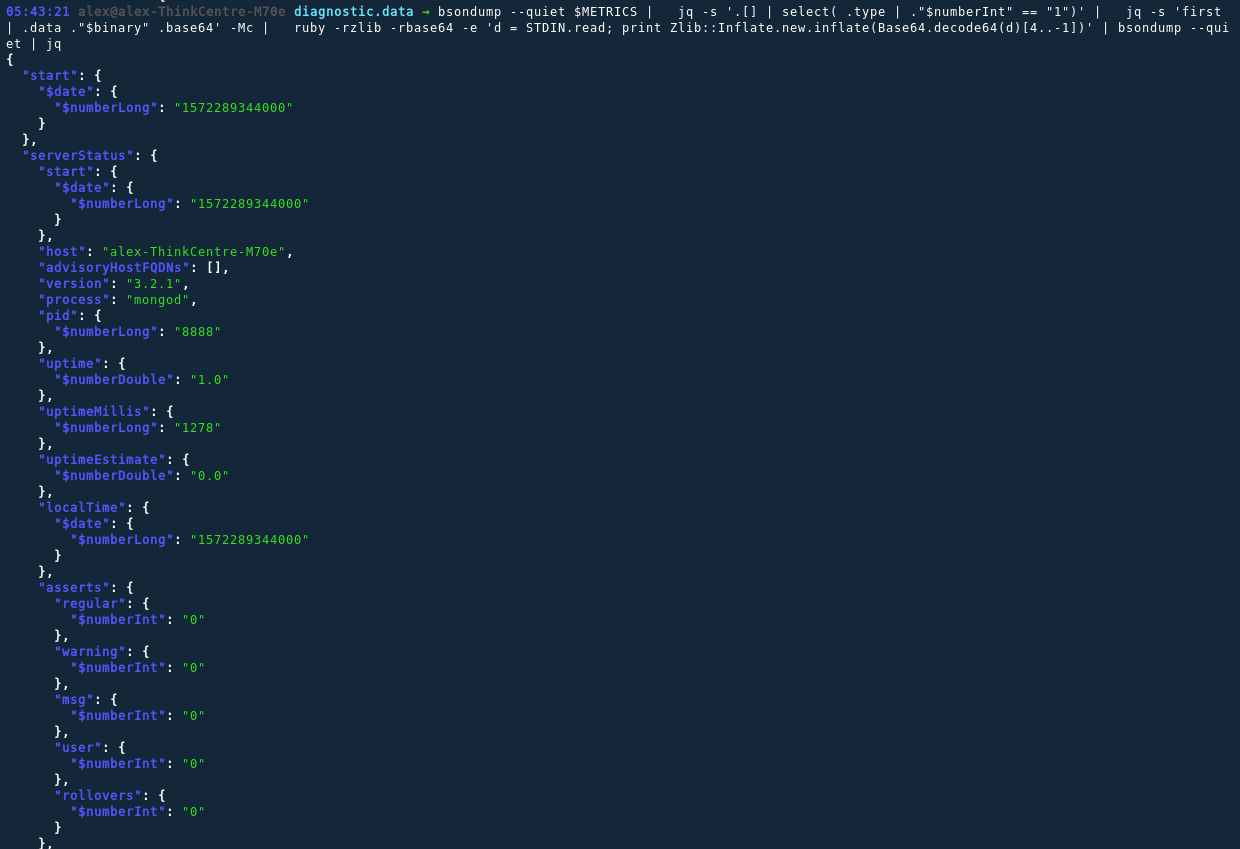
ruby -rzlib -rbase64 -e 'd = STDIN.read; print Zlib::Inflate.new.inflate(Base64.decode64(d)[4..-1])' | \
bsondump --quiet
# bsondump >= 4.0
METRICS=metrics.2019-12-20T14-22-56Z-00000
bsondump --quiet $METRICS | \
jq -s '.[] | select( .type | ."$numberInt" == "1")' | \
jq -s 'first | .data ."$binary" .base64' -Mc | \
ruby -rzlib -rbase64 -e 'd = STDIN.read; print Zlib::Inflate.new.inflate(Base64.decode64(d)[4..-1])' | \
bsondump --quiet
You eagle-eyed Rubyists will notice that we’re clipping the first 4 bytes from the binary data we’re reading from STDIN. This is to drop the header before we try to decompress the stream.
If you don’t do this zlib will complain and fail:
1
2
3
Traceback (most recent call last):
        1: from -e:1:in `<main>'
-e:1:in `inflate': incorrect header check (Zlib::DataError)
The binary data has now been decompressed, and being BSON data we run it through bsondump again and voila:
Hopefully this helps shed some light on what FTDC data is and what it contains. In a future post we’ll look into doing something useful with this treasure trove of telemetry our clusters are generating every 1 second or so.
Comments powered by Disqus.